Display/Store Statistics and Graphical Summary
Data:
To find the descriptive Statistics enter the data in a column.Display Statistics:
1/ Go to Stat => Basic Statistics => Display Descriptive Statistics


2. Double click on the column name to shift in variable box.
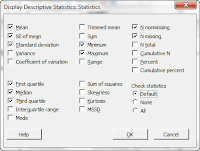
3. Click on Statistics button to choose the statistics tools like mean, median, mode etc.
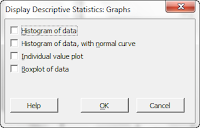
4. Click on Graph button to display the graph.
5. Click on OK button to display the result.
Note: See the result in Session Window
Store Statistics:
1. Go to Stat => Basic Statistics => Store Descriptive Statistics


2. Double click on the column name to shift in variable box.
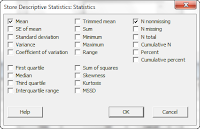
3. Click on Statistics button to choose the statistics tools like mean, median, mode etc.
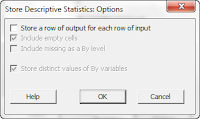
4. Click on Option button to display the result in column etc
5. Click on OK button to display the result.
Note: See the result in Worksheet
Graphical Summary:
1. Go to Stat => Basic Statistics => Graphical Summary2. Double click on the column name to shift in variable box.
3. Click on OK button to display the result.
Note: The result will be displayed in a new box
Click bellow to watch video


0 comments:
Post a Comment
Thank you so much for comment,. Soon you will be replied.