


Simple Regression

Simple Regression:
Example: Compute the least square regression equation of Y on X for the following data. What is the regression coefficient and what does it mean?Data:
X
|
5
|
6
|
8
|
10
|
12
|
13
|
15
|
16
|
17
|
Y
|
16
|
19
|
23
|
28
|
36
|
41
|
44
|
45
|
50
|
Solution in Minitab 17:
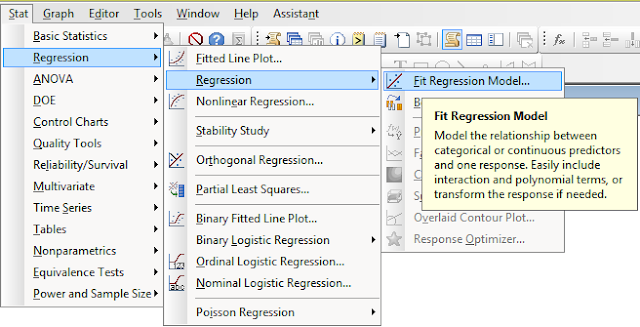
1. Chose Stat > Regression > Regression > Fit Regression Model
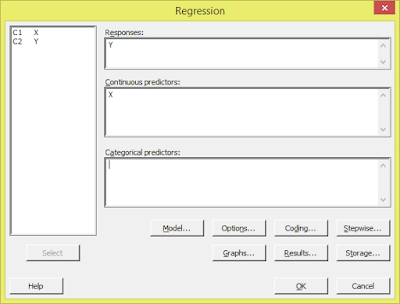
2. Double click on variable name to enter in the variable box. Enter the Variable Y in Response variable box and X in continuous predictor variables box. If you want to use some options just click on those and use which are given as
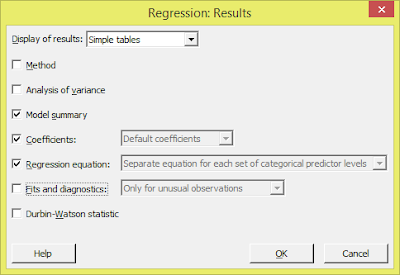
3. Click on the Result button. Choose the results which you want to get i.e. Method, Analysis of variance, Model Summary, Coefficients, Regression equation, etc
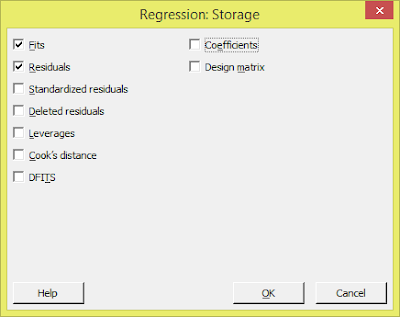
4. Click on Storage button. Check mark the fits and Residuals. Choose other options if you want to store and click ok.
5. Click on OK button and see the result in session window as well as in worksheet (storage result).
Result:
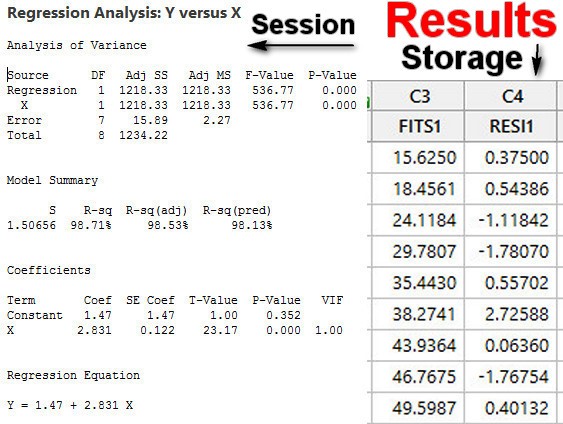
Conclusion:
The estimated
regression coefficient, b=2.831. Which indicates that the value of Y increase
by 2.831 units for a unit increase in X.
Click bellow to watch video


0 comments:
Post a Comment
Thank you so much for comment,. Soon you will be replied.