


Paired t test (dependent)

Paired t test (dependent)
Example: The following data give a paired yields of two varieties of wheat. Each pair was planted in a different locality. Test the hypothesis that the mean yields are equal.
Data:

Solution (through Minitab 17):
1. Enter the data in two columns assign the columns names (i.e. Variety 1 & Variety II)
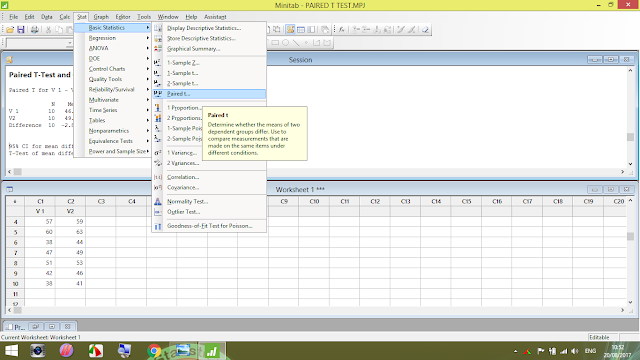
2. Choose Stat>Basic Statistics>paired t
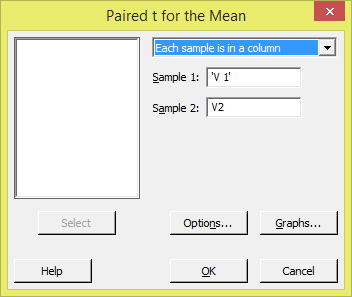
3. Click in Sample 1 box and double click on Variety 1 to enter in Sample 1 box, and Click in Sample 2 box and double click on Variety 2 to enter in Sample 2 box.
4. Click on Option button if you want to change significant level etc.

5. Click on Graphs button and choose the graphs to display.
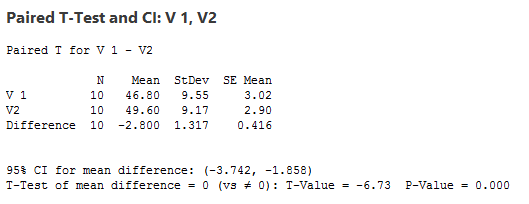
6. Click OK button and see the result in Session window.
Result:
Click bellow to watch video


0 comments:
Post a Comment
Thank you so much for comment,. Soon you will be replied.